Ubiqisense launches a new UI and personalised dashboards
We've given the Ubiqisense platform a cleaner, simpler UI. Finding your way around is easier, and you can get from your whole portfolio down to a single room in fewer clicks. It goes live on 26 November. We're also introducing personalised dashboards, so you can build a view around the numbers that matter most to you. Here's everything you need to know, in one place.
The short version
- When: the new UI goes live overnight on Thursday 26 November 2026.
- Downtime: around 5 minutes in the middle of the night (around 02:00 to 03:00 CET). If you happen to be logged in then, you might be signed out for a couple of minutes.
- What you need to do before: nothing. Your spaces, sensors, users, dashboards and reports all stay as they are.
- What to do on the day: reload any browser tabs and display screens showing the platform.
Watch the walkthrough
Ture Nilsson, our Head of Product, gave a 20-minute tour of the new UI in our webinar on 12 November. If you'd rather see it than read about it, start here.
Short on time? Jump straight to the part you need:
What's new
A cleaner navigation
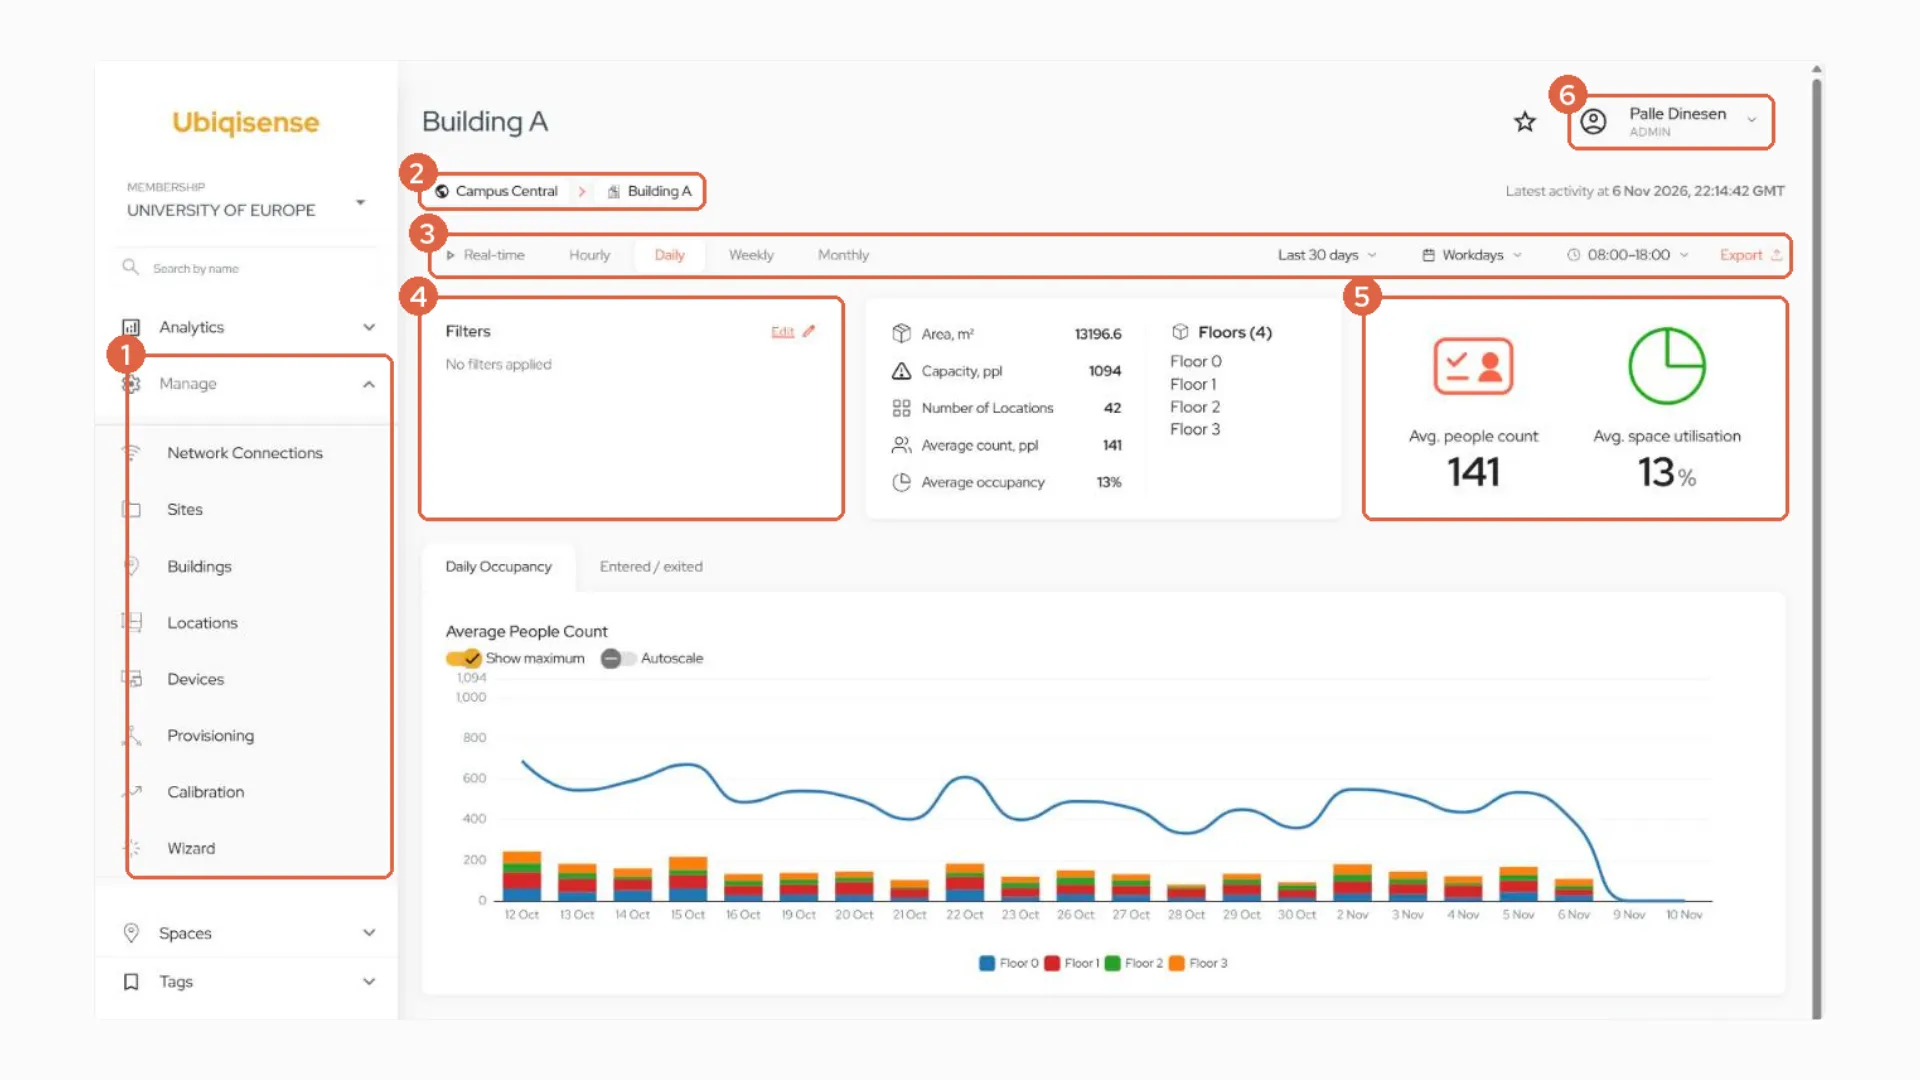
The first thing you'll notice is the sidebar on the left. It's been tidied up, and there are three changes worth knowing about:
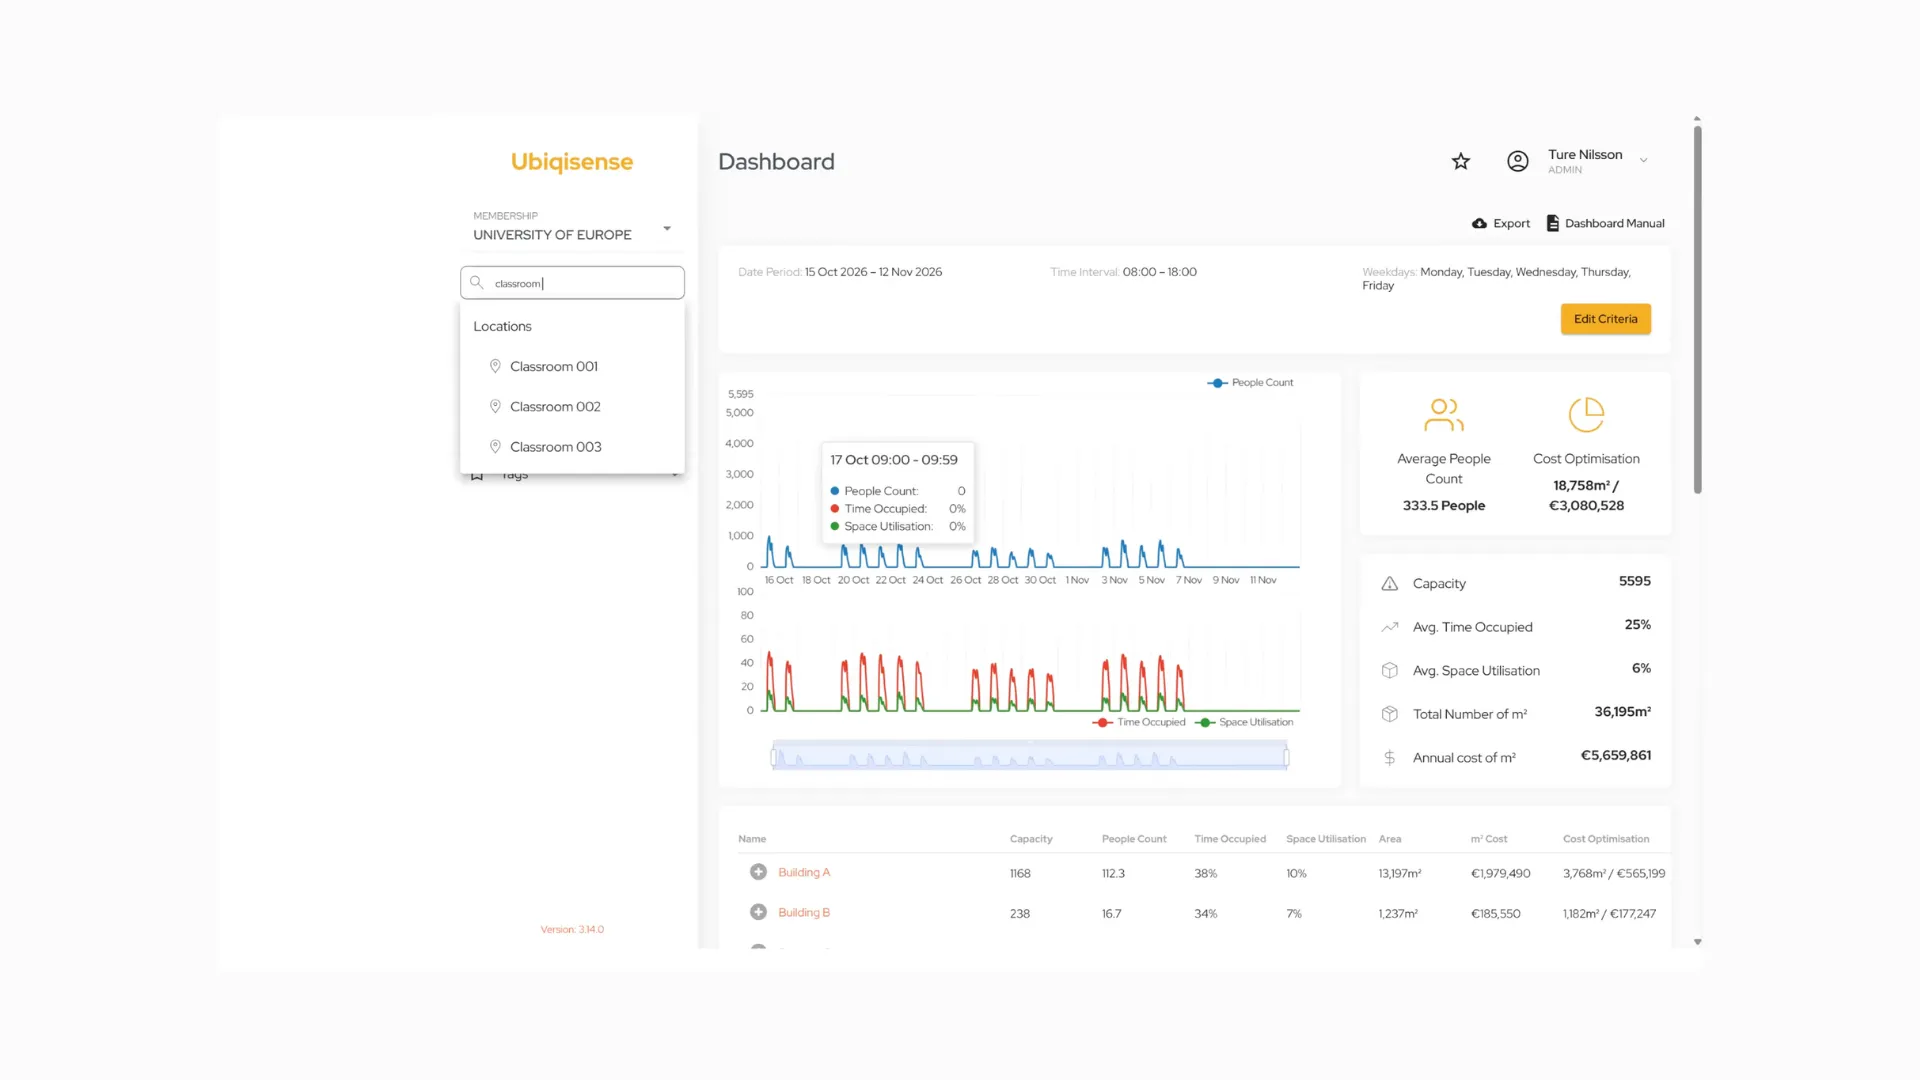
- A search field. Instead of clicking through all your spaces, just type the name of a room, floor or building, and click to go straight there.
- Manage replaces Setup and Admin. This is where you set up your sites, buildings and locations as before, and it's also where you'll now find your devices and their status.
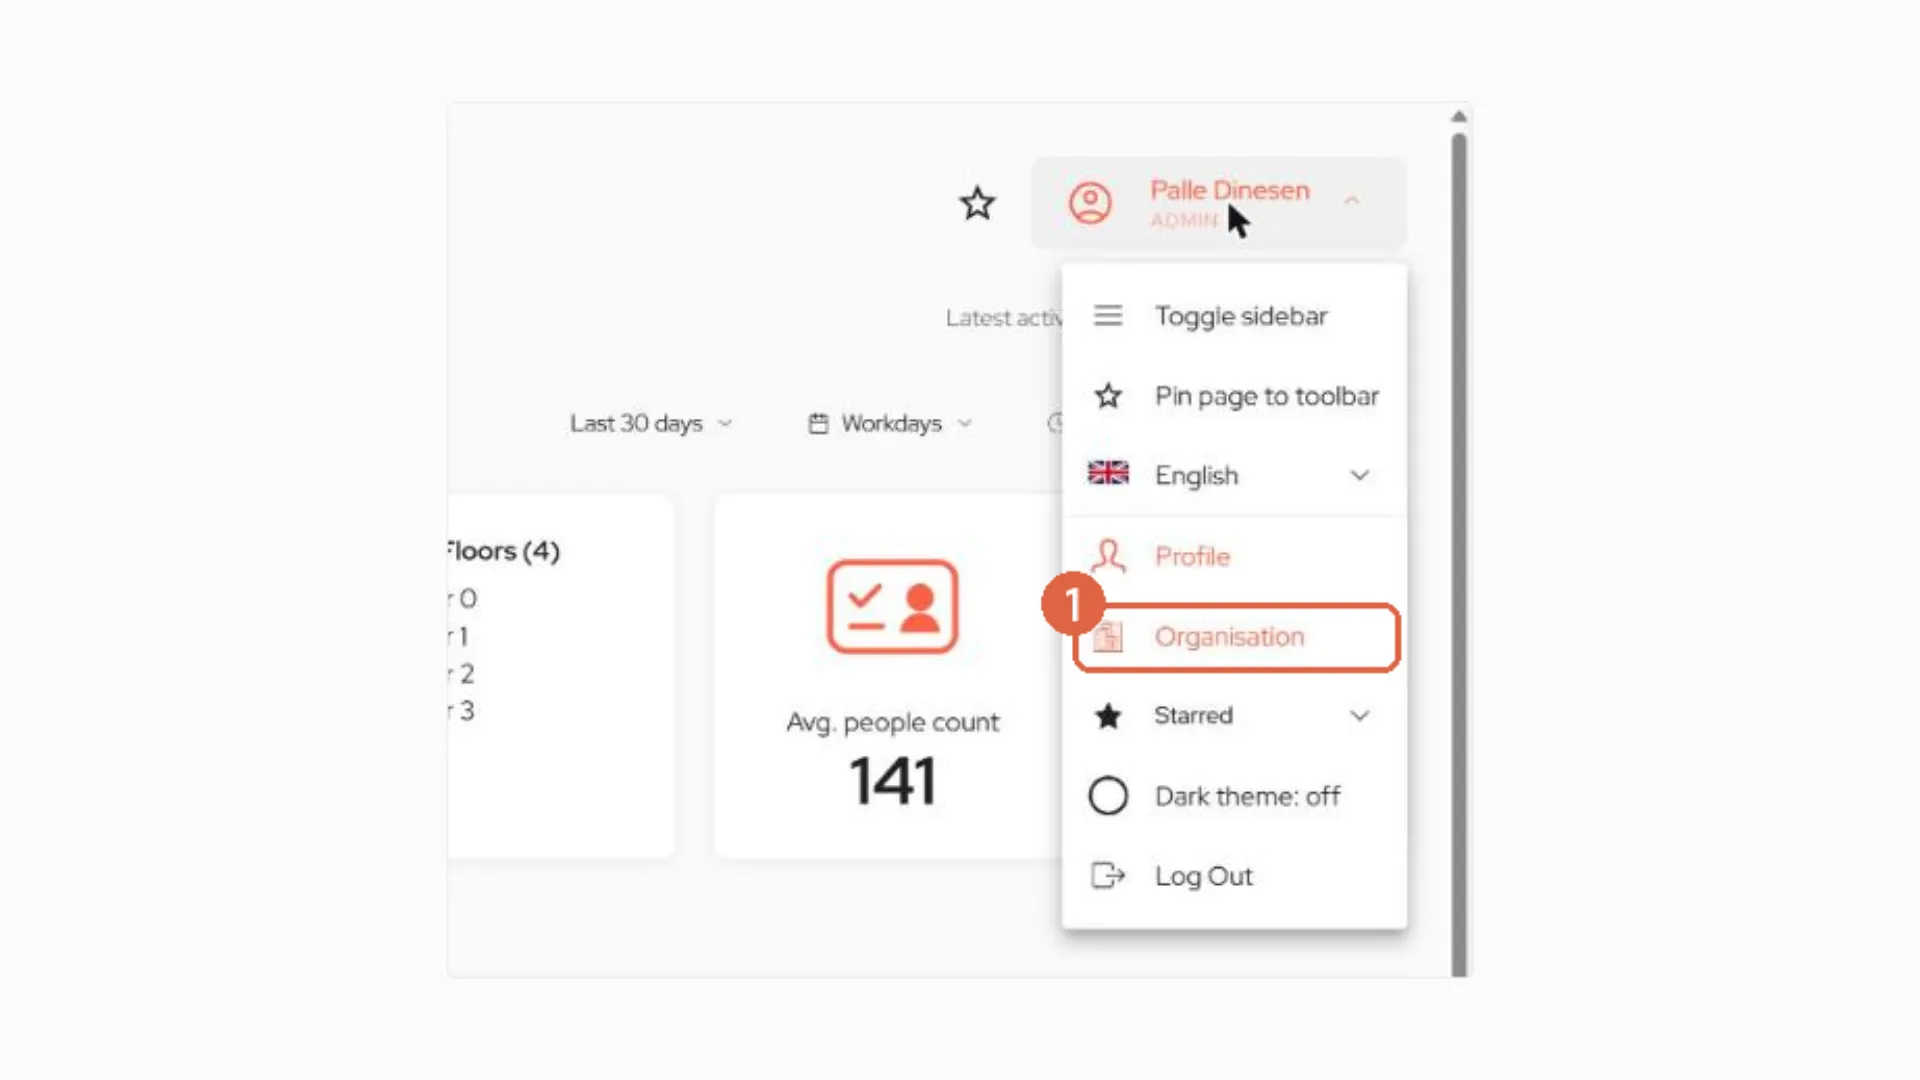
- Organisation has moved. Click your name in the top right corner to find the Organisation page, where admins add users and manage API clients and integrations.
From your whole portfolio down to a single room
The new UI makes it much easier to move between levels. There are two ways to get around:
- Through the sidebar: open Spaces, then a site, building, floor and location type, all the way down to a single room.
- From the page itself: click All Sites for an overview of your whole organisation, then use Details on any site, building or floor to go one level deeper.
At the bottom of the chain, a room page still shows live occupancy, the heat map and daily occupancy, as you're used to. Floor pages still show your floor plan and heat map too.
Your whole organisation at a glance
All Sites opens with the headline numbers for your organisation: total monitored area, capacity, number of locations, average people count and average space utilisation. Below that, every site is listed with a quick view of how it's performing.
One bar to choose your time period
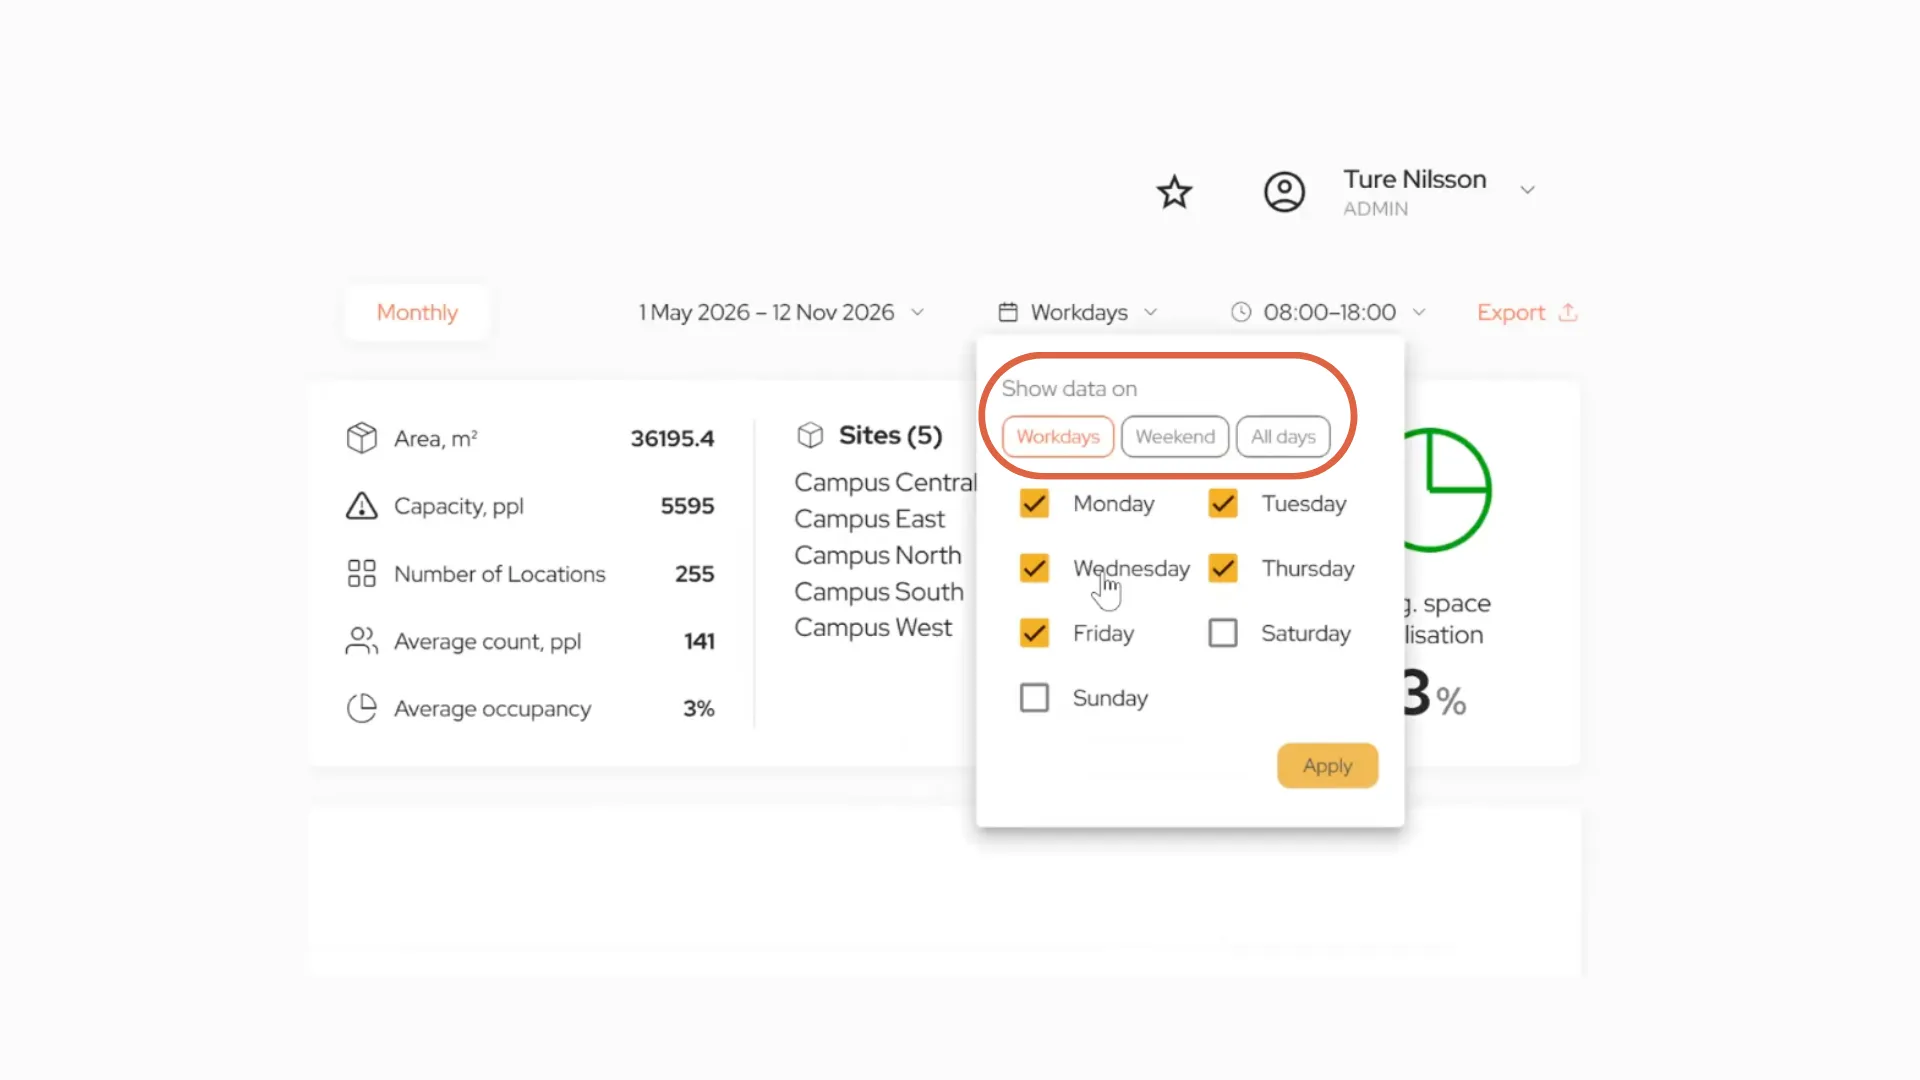
At the top of every page, you choose exactly what period you want to look at:
- real-time, hourly, daily, weekly or monthly
- the date range
- which days: workdays, weekends, all days, or specific days
- which hours, for example 08:00 to 18:00
Whatever you choose follows you from page to page.
More detail for every site, building and floor
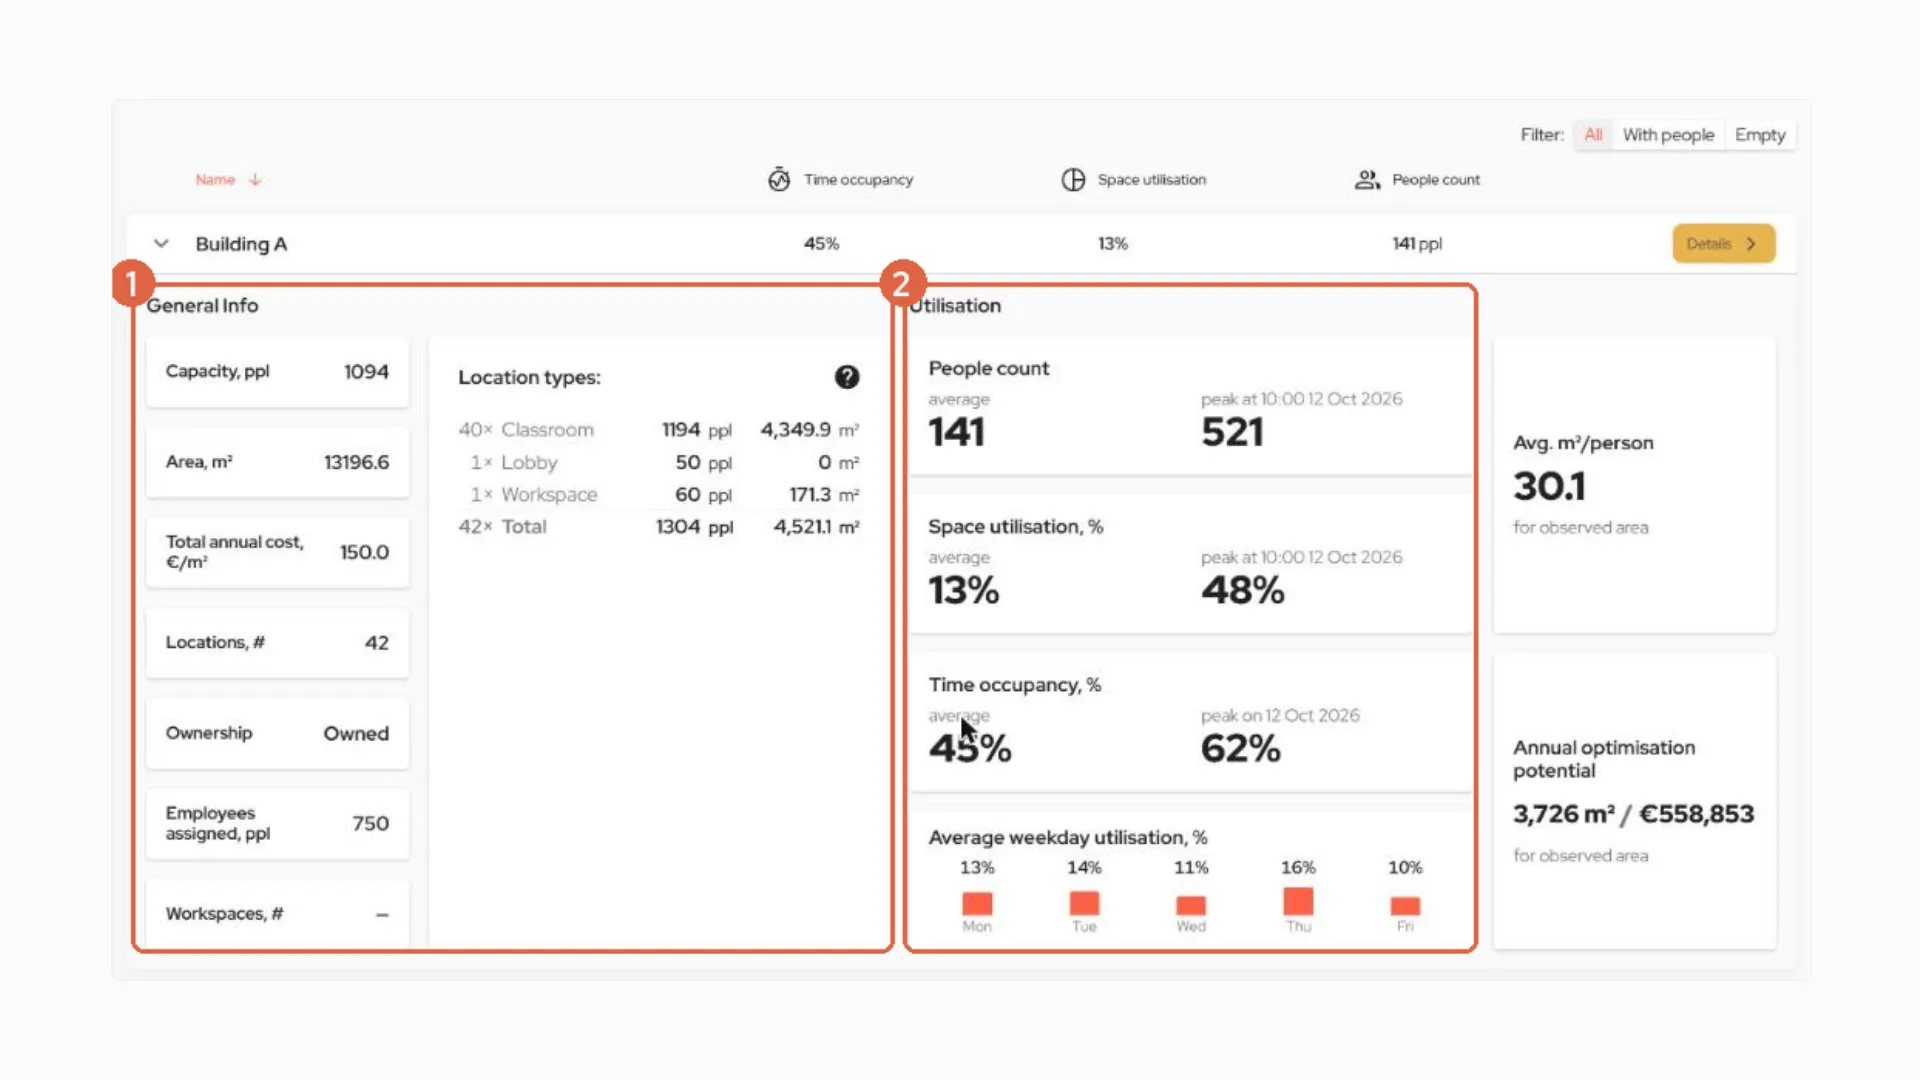
Expand any site, building or floor in the list to see more, without leaving the page:
- General info: capacity, area, annual cost per m², number of locations, ownership (owned, leased or mixed), people assigned, and a breakdown of your location types.
- Utilisation: average and peak people count, space utilisation and time occupancy, with the date each peak happened.
- New: average weekday utilisation, so you can see what an average Monday or Friday looks like in the period you've chosen.
- Area per person and your annual optimisation potential, in m² and cost.
Filters that work across your whole organisation
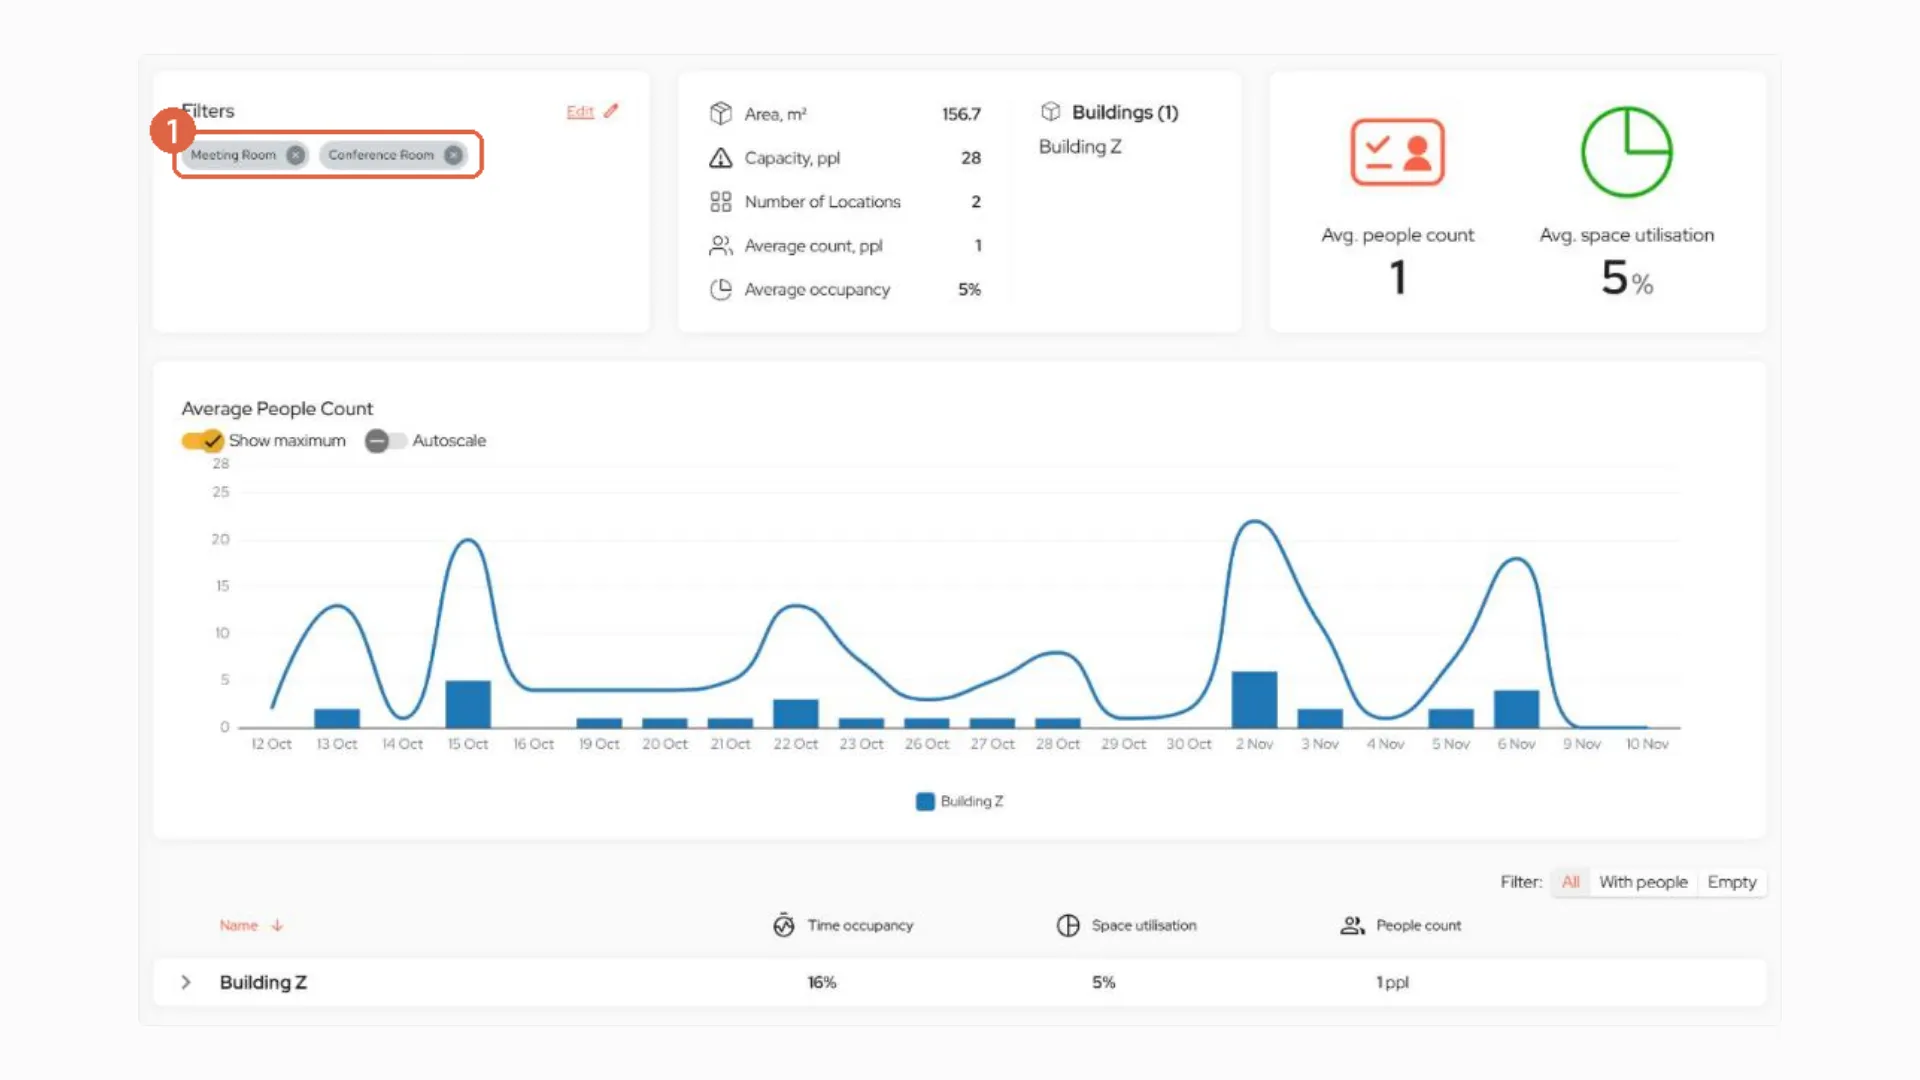
On the All Sites page, you can filter by building, floor, location type, or tag. For example, you could look at only the classrooms tagged to one faculty, across every campus, and see their total area, capacity, and number of locations straight away. It's a quick way to understand how a department or faculty uses space.
Available now: personalised dashboards
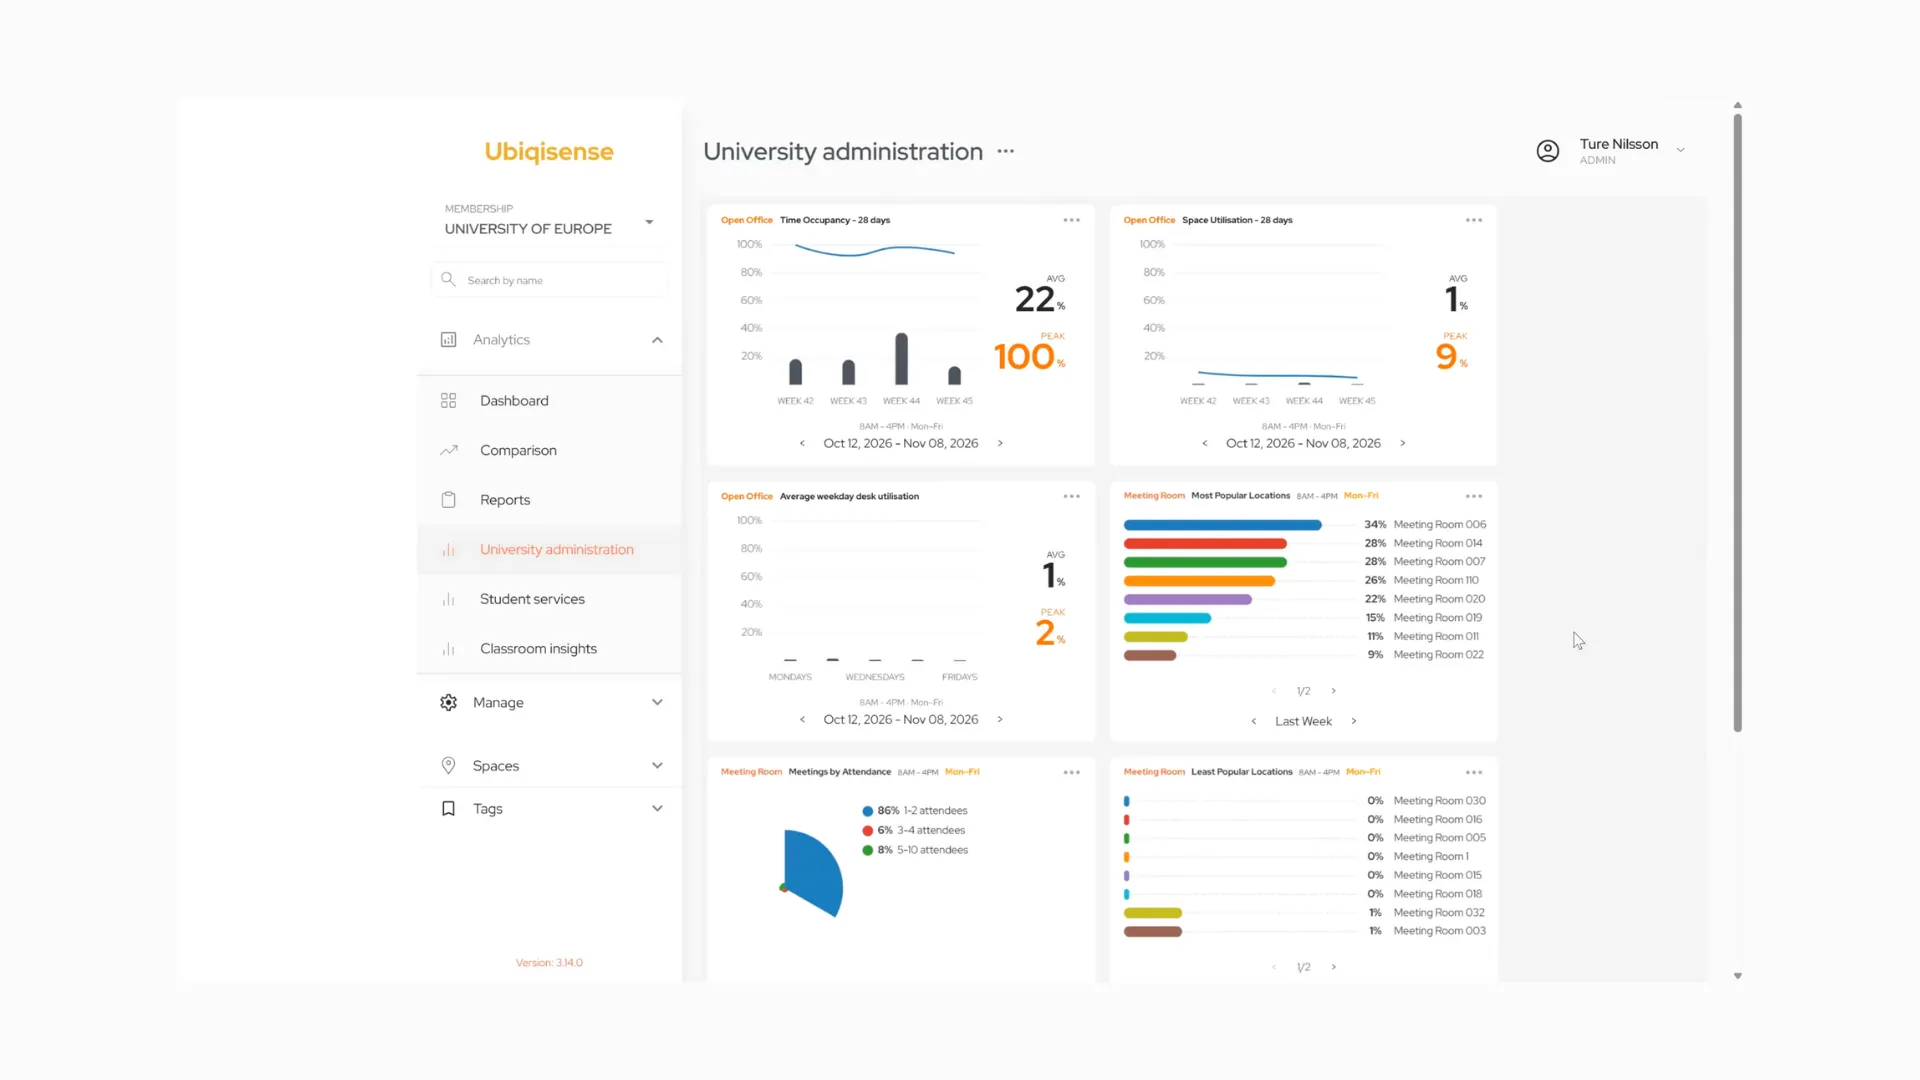
In the webinar, Ture also showed something you can start using today. Personalised dashboards let each user build their own dashboard, with just the metrics they care about. For example:
- how often open offices and desks are used, and on which weekdays
- your most and least popular meeting rooms
- Meetings by Attendee, showing how many people typically use your meeting rooms, which helps with right-sizing
- classroom use by faculty or department, using tags, and comparing them side by side
You'll find your dashboards under Analytics, below Dashboard, Comparison and Reports. If you'd like to start using them, just let us know.
Share a widget or dashboard
Want to show a colleague or someone in management how a space is being used? Click the three dots on any widget, or next to a dashboard's name:
- Download as PNG to drop it into a presentation or report.
- Embed link to share it as a link, even with people outside your organisation who don't have a Ubiqisense login. You can also embed it in another system you use, or show a whole dashboard on a screen in the office or at the entrance.
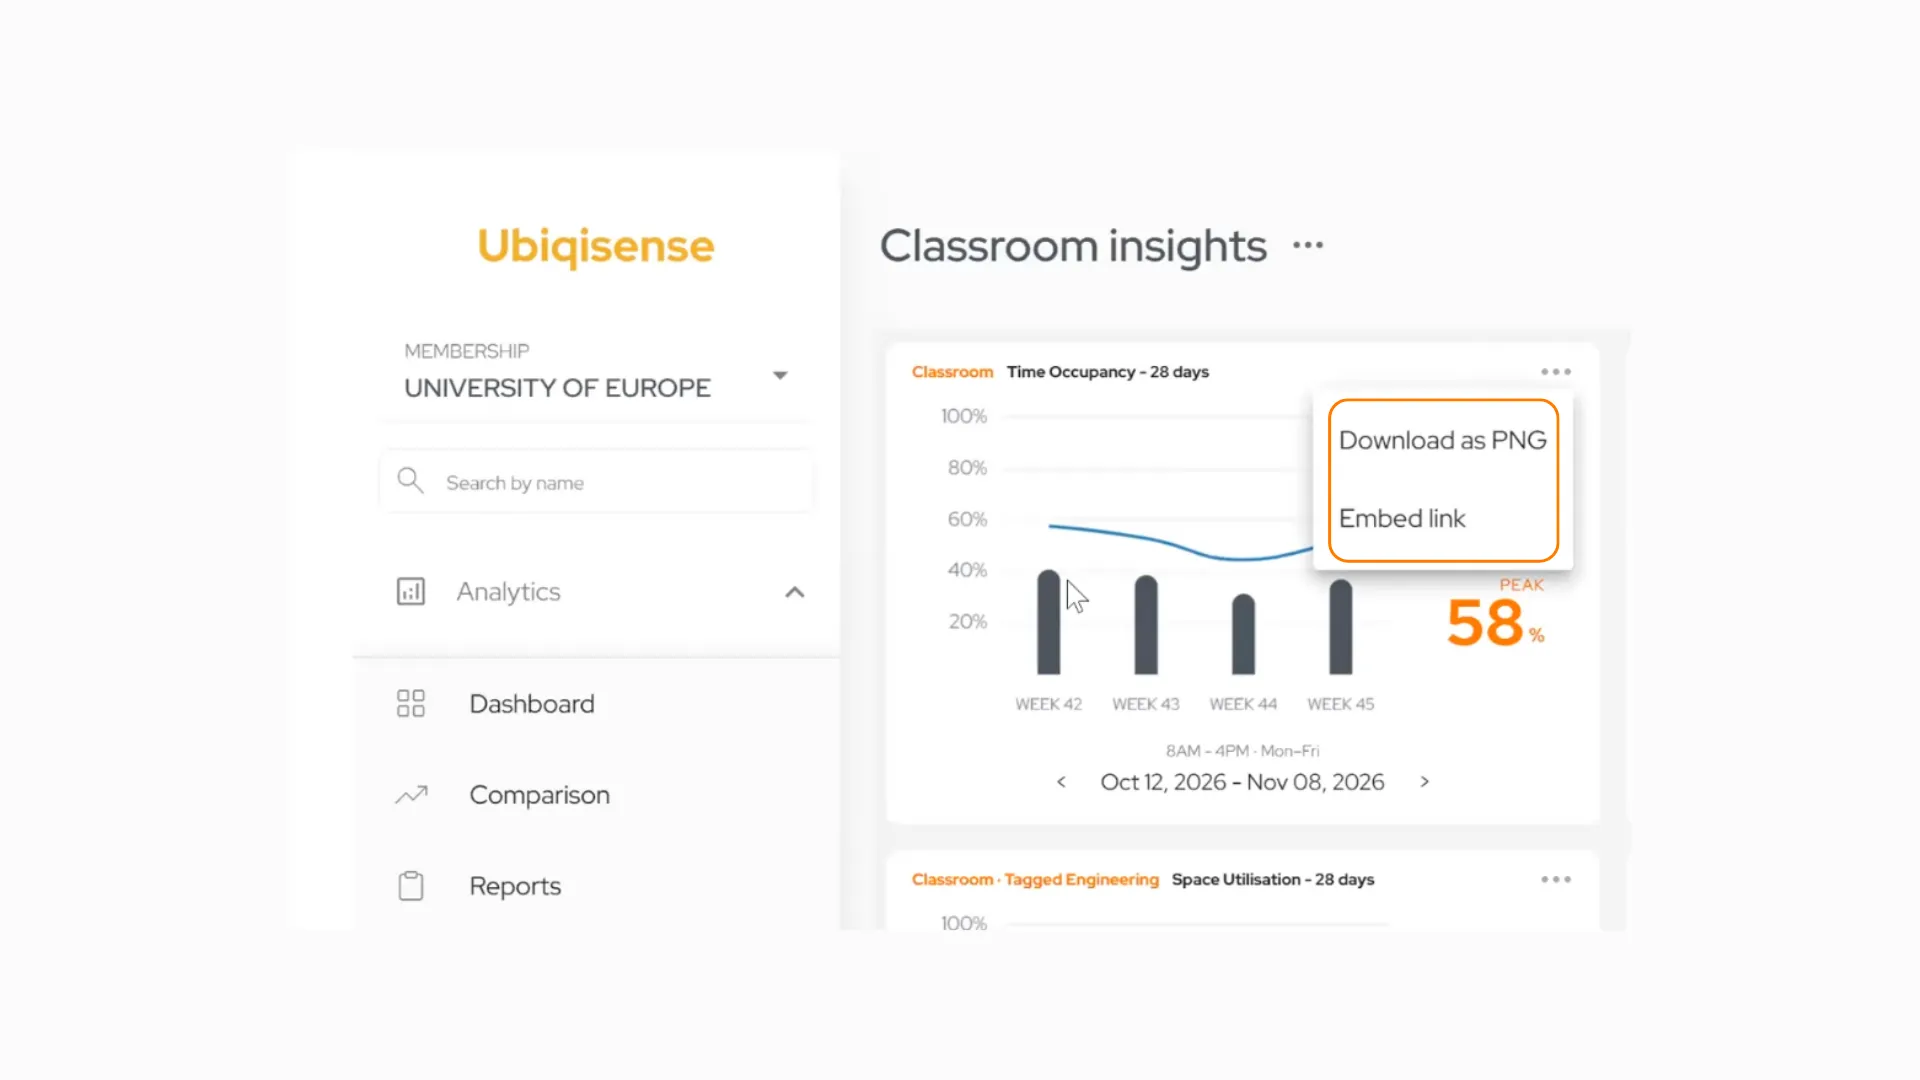
Anyone with an embed link can see that widget or dashboard, but nothing else, and they can't change anything. You can delete or regenerate a link at any time, and the old one stops working straight away.
Good to know
Your numbers may look higher at first.
Pages open on your working days, 08:00 to 18:00, so averages may look higher than you're used to. That's the time period changing, not your buildings. To compare like with like, choose all days and all hours in the period bar.
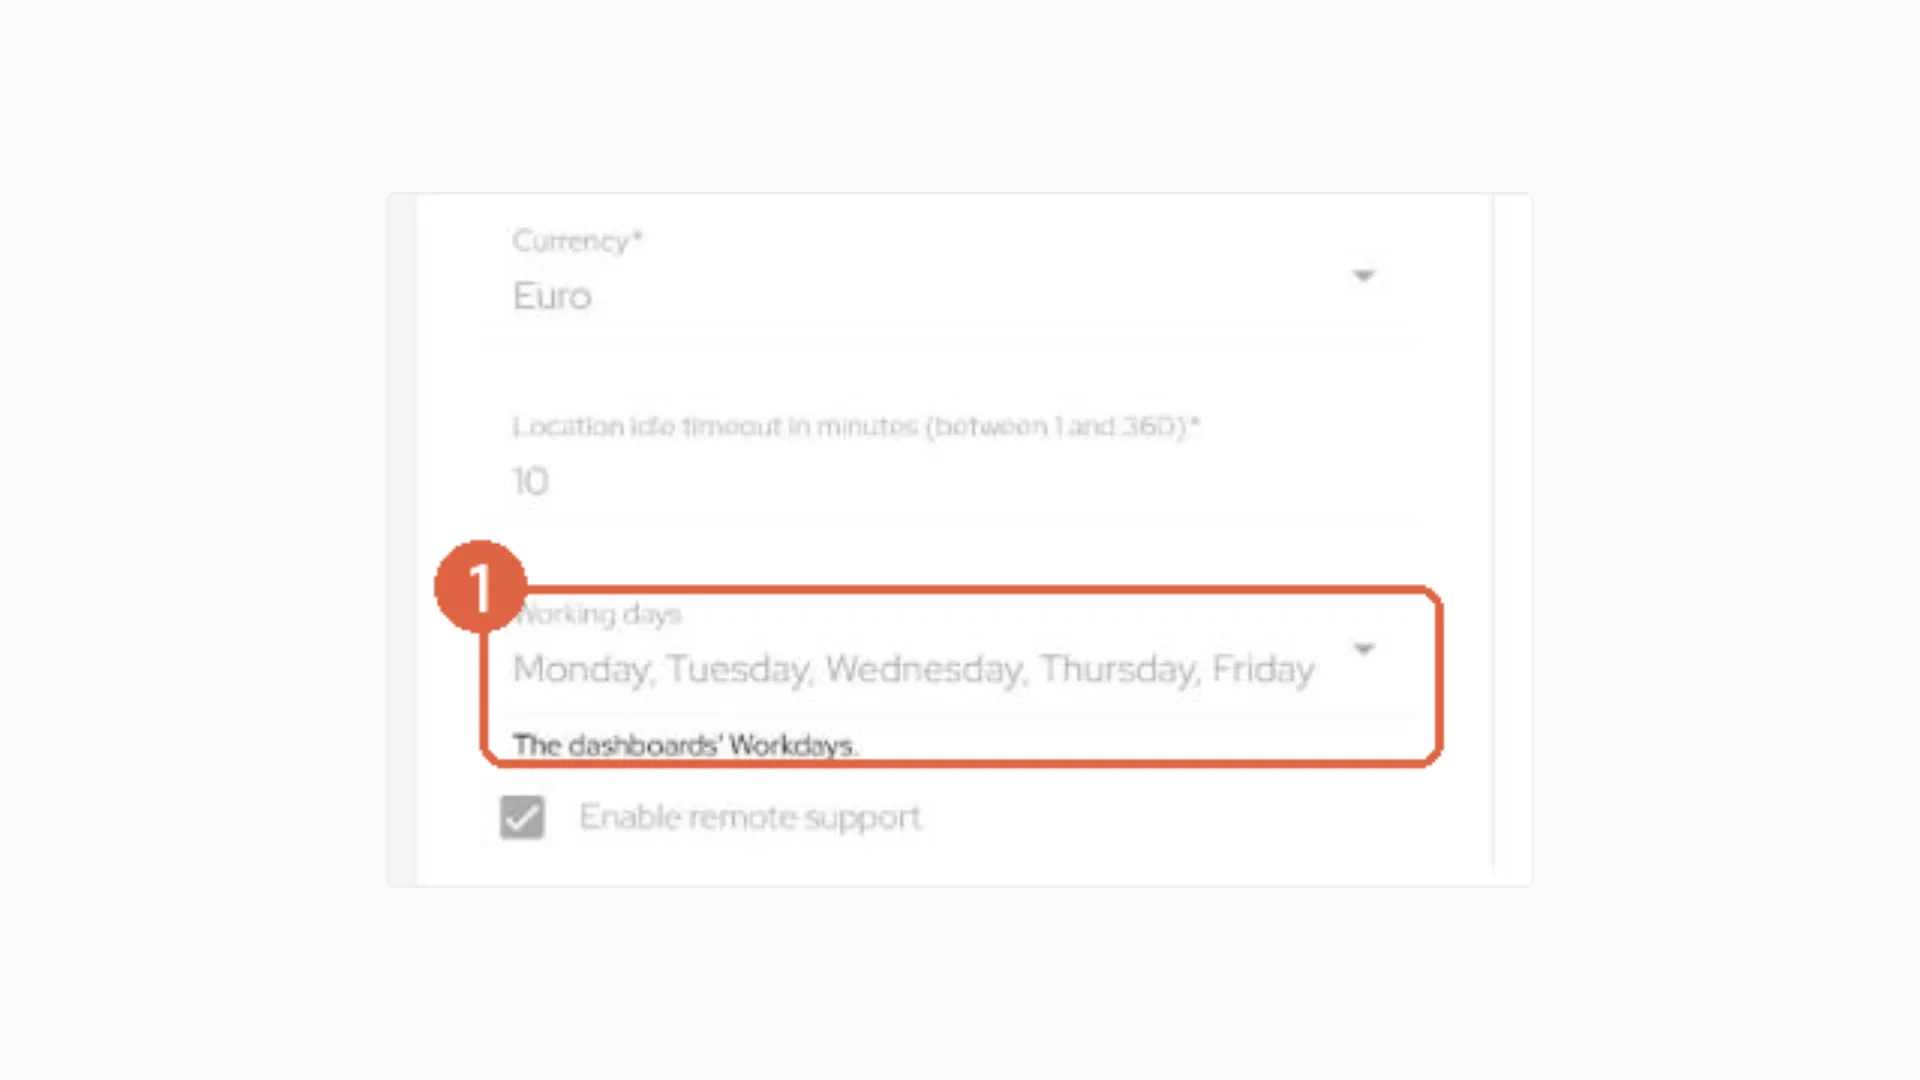
Admins: check your working days.
Your organisation's working week decides what "workdays" means across the platform. If yours isn't Monday to Friday, an admin can change it on the Organisation page.
A few smaller changes.
- Hours with no data now show as gaps rather than zeros.
- Dates read day-month-year, and weeks start on Monday.
- Floors are listed in natural order, so Floor 2 comes before Floor 10.
- If you use our API to call the occupancy endpoints, there are a few small changes. Get in touch and we'll share the details.
Frequently asked questions
When does the new UI go live?
Overnight on Thursday 26 November 2026.
Will there be any downtime?
Only around 5 minutes, in the middle of the night. If you're logged in at that moment, you might be signed out for a couple of minutes. After that, reload any open tabs and screens.
Do I need to do anything before the release?
No. Your spaces, sensors, users, dashboards, reports and starred pages all carry over, and your bookmarks keep working.
Can we keep the old UI?
No, the new UI applies to everyone. If something feels harder than before, please tell us. Your feedback shapes what we do next.
Where has the Organisation page gone?
Click your name in the top right corner, then Organisation.
Where are my devices?
Under Manage in the sidebar, which replaces Setup.
How do I get personalised dashboards?
They're already available in the platform.
Still have questions?
You can reach out to Lucinda Duncan, our Head of Customer Success, at lucinda.duncan@ubiqisense.com. For anything else, email us at info@ubiqisense.com.
Read more

Aranet and Ubiqisense team up to...
